In a previous article, we unpacked the “implementation bottleneck” plaguing the Merdeka Curriculum transformation. While macro-level policies have successfully reached school principals, they remain stalled at the classroom teacher level. However, if frontline educators in the classroom have not fully mobilized, what does this mean for student cognitive outcomes? Specifically, what is the fate of students in institutions facing a double workload, such as Madrasah Aliyah (Islamic Senior High Schools)?
To answer this crucial question, this analysis tracks student performance using longitudinal data panel econometric modeling to evaluate National Assessment scores.
Mathematically, the longitudinal data panel equation estimated in Stata for the student pillar (Table 3 and Table 4) is specified as follows:
Yit = β0 + β1merdeka_dummyit + β2MAi + β3SMKi + β4SES_sekolahit + β5urban_dummyi + β6kota_dummyi + ui + εit
Variable Definitions:
- Yit: The dependent variable for school i in year t. This variable is tested separately across two primary models:
- LIT (School Literacy Achievement Score).
- NUM (School Numeracy Achievement Score).
- β0: The pure constant (Intercept) when all independent variables are set to zero. In your Stata output, this is labeled as
_cons. - β1merdeka_dummyit: The primary policy intervention effect variable. It takes a value of 1 if school i in year t has implemented the Merdeka Curriculum, and 0 if it still uses the 2013 Curriculum (baseline). The value of β1 measures the net impact of the curriculum nationwide.
- β2MAi and β3SMKi: Indicator (dummy) variables for institutional types. In this model, State General Senior High Schools (SMA Negeri) are intentionally omitted to serve as the reference group (omitted/reference group). Thus, the coefficient β2 measures the net difference in scores between MAN and SMAN, while β3 measures the net difference between SMKN and SMAN.
- β4 (Background Control Variables):
SES_sekolah: The school-level Socio-Economic Status index used to control for facility-and-wealth bias.urban_dummy: Geographic classification (1 = Urban, 0 = Rural).kota_dummy: Regional administrative category (1 = City/Municipality, 0 = Regency).
This analysis yields a stark, striking contrast—a major anomaly we term the Madrasah Paradox. Even as government evaluation instruments score the teaching quality of madrasah educators below that of their peers, their students’ cognitive achievements have leaped far ahead of mainstream public schools.
To map the baseline performance of foundational skills across institutional streams, let us dissect the descriptive overview of average student Literacy scores on the ground below:
Table 1: Comparison of Average Student Literacy Scores Across Institutions| School Type | Mean | SD | N |
|---|---|---|---|
| MA | 67.753 | 9.406 | 99 |
| SMA | 64.734 | 11.385 | 1.624 |
| SMK | 61.453 | 9.623 | 733 |
Descriptively, Table 1 illustrates the absolute landscape of reading comprehension at the upper secondary level. Students in Madrasah Aliyah (MA) dominate with the highest average Literacy score at 73.19 points. General Senior High Schools (SMA) follow in second place with 64.67 points, while the vocational track (SMK) sits at the bottom with an average of 56.66 points. These raw, field-level figures indicate a powerful intrinsic energy within madrasahs when it comes to sharpening student literacy skills.

Madrasahs outperform in literacy and numeracy
Next, we must examine whether this absolute dominance held by madrasah students consistently carries over to their mathematical logic. Let us look at the descriptive data for Numeracy scores below:
Table 2: Comparison of Average Student Numeracy Scores Across Institutions| School Type | Mean | SD | N |
|---|---|---|---|
| MA | 54.848 | 6.958 | 99 |
| SMA | 54.503 | 7.815 | 1.624 |
| SMK | 52.340 | 6.461 | 733 |
Mirroring the literacy pilar, the quality of foundational mathematics and numeric logic in Table 2 once again places Madrasah Aliyah (MA) at the absolute forefront, scoring an average of 57.29 points. This mean consistently outperforms regular SMAs, which are held back at 50.81 points, and SMKs at the 45.41 level. Through these two initial descriptive tables, it is evident that in the aggregate, the output of madrasah students appears vastly superior.
However, this advantage in average scores cannot be statistically validated as a pure institutional effect until we control for confounding variables. It is entirely possible that madrasahs excel simply because they happen to be located in major cities or are supported by a strong parental Socio-Economic Status (SES).
To address this, this analysis tests the robustness of these findings using a Cluster-Robust panel regression model (locking error variances across 546 school clusters). This model evaluates the net impact of the Merdeka Curriculum intervention as well as institutional asymmetries by compelling the State SMA category to act as the baseline reference (baseline coefficient = 0).
To make it easier for readers to interpret the direction and significance of the net impact of all variables, we present a visual representation of Madrasah Aliyah’s academic edge below.
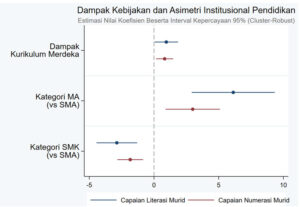
The 0 on the vertical dashed line in Figure 1 represents the neutral line (no effect). If a coefficient point and its horizontal wings (95% confidence intervals) fall entirely to the right of the 0 line, it means the variable exerts a statistically valid positive impact. Notice how both the Merdeka Curriculum intervention and the MA Category stand firmly in the positive zone (right side), while the SMK Category is pushed into the negative zone (left side). Next, let us examine the panel regression estimation table for the student Literacy pillar:
Table 3: Robust Panel Regression Estimation on Student Literacy Scores| LIT | Coef. | St.Err. | t-value | p-value | [95% Conf. Interval] | Sig |
|---|---|---|---|---|---|---|
| Policy Intervention (Curriculum) | ||||||
| Merdeka Curriculum (1) | 0.952 | 0.463 | 2.06 | 0.040 | 0.045 to 1.859 | ** |
| School Type Category (vs SMAN) | ||||||
| MA | 6.126 | 1.637 | 3.74 | 0.000 | 2.918 to 9.334 | *** |
| SMK | -2.871 | 0.801 | -3.59 | 0.000 | -4.440 to -1.302 | *** |
| SES_sekolah | 0.279 | 0.012 | 24.09 | 0.000 | 0.257 to 0.302 | *** |
| Geographic Location (vs Rural) | ||||||
| Urban (1) | 5.353 | 0.936 | 5.72 | 0.000 | 3.519 to 7.187 | *** |
| Regional Administrative Status (vs Regency) | ||||||
| City (1) | 3.922 | 1.106 | 3.55 | 0.000 | 1.754 to 6.089 | *** |
| Constant (_cons) | 46.098 | 0.691 | 66.69 | 0.000 | 44.743 to 47.452 | *** |
| Mean dependent var: | 65.531 | SD dependent var: | 11.605 |
| Overall r-squared: | 0.368 | Number of obs: | 1299 |
| Chi-square: | 1153.363 | Prob > chi2: | 0.000 |
| R-squared within: | 0.564 | R-squared between: | 0.287 |
| Significance levels: *** p<0.01, ** p<0.05, * p<0.1 | |||
The panel regression results in Table 3 confirm two critical realities. First, nationwide, the Merdeka Curriculum intervention significantly boosts a school’s literacy score by 0.95 points ($P = 0.040$). Second, and most dramatically, when all control variables are held constant, students at State Madrasah Aliyah (MAN) record a massive Literacy score jump of 6.12 points higher ($P = 0.000$) compared to regular SMAN. Conversely, public vocational students (SMKN) lag behind the SMAN baseline by -2.87 points.
To see whether this monumental surge among madrasah institutions consistently holds up against a student’s numerical reasoning after strict controls, let us turn to Table 4.
Table 4: Robust Panel Regression Estimation on Student Numeracy Scores| NUM | Coef. | St.Err. | t-value | p-value | [95% Conf. Interval] | Sig |
|---|---|---|---|---|---|---|
| Policy Intervention (Curriculum) | ||||||
| Merdeka Curriculum (1) | 0.824 | 0.334 | 2.47 | 0.014 | 0.170 to 1.479 | ** |
| School Type Category (vs SMAN) | ||||||
| MA | 2.991 | 1.071 | 2.79 | 0.005 | 0.892 to 5.091 | *** |
| SMK | -1.835 | 0.509 | -3.60 | 0.000 | -2.834 to -0.837 | *** |
| SES_sekolah | 0.215 | 0.008 | 25.68 | 0.000 | 0.199 to 0.232 | *** |
| Geographic Location (vs Rural) | ||||||
| Urban (1) | 3.301 | 0.588 | 5.62 | 0.000 | 2.149 to 4.453 | *** |
| Regional Administrative Status (vs Regency) | ||||||
| City (1) | 2.789 | 0.830 | 3.36 | 0.001 | 1.162 to 4.416 | *** |
| Constant (_cons) | 40.704 | 0.455 | 89.40 | 0.000 | 39.811 to 41.596 | *** |
| Mean dependent var: | 55.376 | SD dependent var: | 7.904 |
| Overall r-squared: | 0.398 | Number of obs: | 1299 |
| Chi-square: | 1122.142 | Prob > chi2: | 0.000 |
| R-squared within: | 0.561 | R-squared between: | 0.304 |
| Significance levels: *** p<0.01, ** p<0.05, * p<0.1 | |||
Table 4 rounds out the proof of the robust academic performance of madrasahs. The Merdeka Curriculum intervention is again shown to solidly boost nationwide student numeracy scores by 0.82 points ($P = 0.014$). Once again, State Madrasah Aliyah emerges at the top, scoring a net numeracy result that is 2.99 points significantly higher ($P = 0.005$) than regular SMAN, while SMKN consistently lags behind in a negative institutional asymmetry at -1.83 points.
How do we untangle this puzzling anomaly? How is it possible that our previous analysis of the teacher pillar found MAN teaching quality scored lower (-4.62 points) than general high schools, yet at the same time, their students’ cognitive scores outpaced SMAN by over 6 points?
This analysis points to a structural failure in the government’s measurement metrics (the Learning Environment Survey/Sulinjar). The current macro-evaluation indicators appear to suffer from design bias; they favor the teaching flexibility found in general public schools, but completely fail to capture the essence of knowledge transmission within the madrasah ecosystem. State metrics grade their teachers’ methods as suboptimal, but student outcomes prove exactly the opposite.
There are hidden mechanisms working outside formal classroom hours that serve as the engine driving up test scores in madrasahs—dynamics that ministerial questionnaires fail to log.
First, the cultural habitus of Text Literacy. The madrasah tradition, which requires students to grapple with dense, structurally complex, and analytical religious texts, organically trains high-level reading comprehension. This explains why their literacy coefficient is six times larger than the impact coefficient of the standard curriculum.
Second, the Boarding School Discipline Ecosystem. The presence of flagship (unggulan) and institutional MAN models that operate under a boarding school system provides an intensive, structured learning environment for students outside formal school hours—a learning time luxury that regular SMAN students rarely enjoy uniformly.
Rigorous Student Input Selection: Rising interest among urban middle-class families shifting their preferences toward high-quality religious schools means that the intake screening for modern model MANs has become hyper-competitive.
This analysis suggests that we must avoid getting trapped in the mere glorification of the Merdeka Curriculum’s administrative rollout. If the government evaluates educational quality solely based on the readiness of paperwork or formal surveys of teacher instruction, it will remain blind to the living social and cultural capital built into frameworks like the madrasah. True educational reform does not happen by homogenizing every institution with a single rigid metric, but rather by learning how cultural ecosystems successfully educate students—even when state administration metrics write them off as lagging behind.