
Upper secondary education development policies are heavily driven by administrative standardization, particularly through a unified national curriculum intended to equalize educational quality. However, does such a standardized intervention exert uniform efficacy across vastly different macro-geographic and micro-local landscapes? Longitudinal panel data from the National Assessment reveals a stark sociological reality: spatial policy interventions do not operate homogeneously. Instead, they asymmetrically widen the cognitive divide between academic tracks (SMA) and vocational tracks (SMK).
To evaluate the extent to which these geographic barriers dictate students’ reasoning capacities, we examine the micro-spatial impact—specifically the urban-rural dichotomy and regional administrative status—within the academically oriented upper secondary track.
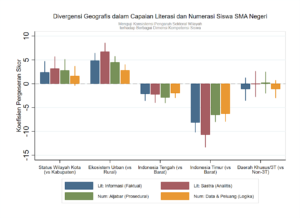
Figure 1 illustrates sharp spatial disparities at both the micro and macro levels within public academic high schools (SMAN). The institutional advantage of urban ecosystems is overwhelmingly dominant. The coefficient for Urban1 surges across all cognitive dimensions, highlighted by an acute leap of nearly +7 points in analytical verbal skills (Lit: Sastra). Conversely, when shifting to macro-regional clusters, cognitive achievement plummets into negative territory, with Eastern Indonesia hitting the lowest trough—dropping past the -10 point threshold in analytical literacy.
Figure 1 demonstrates that within the academic stream (SMAN), geography functions as a form of cognitive destiny. This substantial urban-rural gap confirms a heavy accumulation of cultural capital and an agglomeration of critical thinking resources concentrated in urban centers. Ironically, looking at the policy control variable for affirmative action—the 3T1 indicator (Frontier, Outermost, and Remote Regions)—its efficacy is stagnant and fails to statistically shift from zero. This indicates that the government’s administrative designation of remote areas has failed to counteract the structural disadvantages faced by rural academic students.
A critical question for policymakers emerges: does this pervasive spatial discrimination also manifest in the vocational and technical education track?
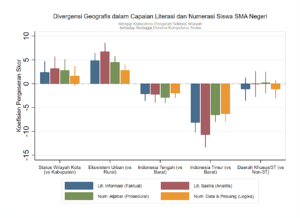
The spatial dynamics presented in Figure 2 reveal a highly compelling shift within the public vocational school (SMKN) subsample. Unlike the academic track, the urban ecosystem cluster (Urban1) loses its predictive power in the vocational stream. Its effect sizes diminish and fail to demonstrate statistical significance. Nonetheless, the macro-regional disparities remain deeply entrenched, with Eastern Indonesia continuously exhibiting a severe deficit, dropping past -10 points in students’ analytical literacy.
Figure 2 underscores the institutional characteristics of vocational schools, which appear significantly more democratic and resilient against local urban-rural biases. The absence of a significant urban effect suggests that the core blueprint of vocational education—relying heavily on standardized workshop machinery, industrial apprenticeships, and psychomotor modules—successfully mitigates the sociological privileges typically monopolized by urban students. However, the 3T1 variable displays an alarming negative correlation, plummeting by up to -10 points in analytical literacy and data logic (NUM_DAT). This demonstrates that vocational schools in remote regions suffer from a “double isolation”: a severe deficit in modern technological workshop infrastructure, compounded by the complete absence of a robust local industrial ecosystem to provide quality apprenticeships.
To ensure the precision of these visual findings, it is essential to juxtapose the results of these separate panel data regressions to evaluate the underlying p-values and latent coefficient significances.
Table 1: Fixed-Effects Panel Regression Estimations on Regional Sectoral Impacts (SMAN)
| Independent Variables | (1) Lit: Information | (2) Lit: Literature | (3) Num: Algebra | (4) Num: Data |
|---|---|---|---|---|
| merdeka_dummy | 1.776*** | 1.032* | 0.972** | 0.757* |
| (0.000) | (0.070) | (0.022) | (0.090) | |
| RSD | -0.008 | 0.001 | 0.001 | -0.010 |
| (0.470) | (0.965) | (0.908) | (0.312) | |
| RPI | 0.009 | 0.020* | 0.029*** | 0.015 |
| (0.347) | (0.087) | (0.001) | (0.110) | |
| SES_school | 0.262*** | 0.229*** | 0.164*** | 0.248*** |
| (0.000) | (0.000) | (0.000) | (0.000) | |
| Urban1 | 4.872*** | 6.727*** | 4.483*** | 2.841*** |
| (0.000) | (0.000) | (0.000) | (0.000) | |
| dummy_timur | -8.148*** | -10.726*** | -6.541*** | -6.302*** |
| (0.000) | (0.000) | (0.000) | (0.000) | |
| 3T1 | -1.136 | -0.056 | 0.234 | -1.131 |
| (0.357) | (0.968) | (0.840) | (0.240) | |
| Constant | 25.206*** | 23.502*** | 30.315*** | 22.136*** |
| (0.000) | (0.000) | (0.000) | (0.000) | |
| Observations (N) | 846 | 846 | 846 | 846 |
| R-squared (R2) | 0.613 | 0.543 | 0.465 | 0.601 |
Note: p-values are reported in parentheses below the coefficients. Statistical significance: * p < 0.10, ** p < 0.05, *** p < 0.01.
The econometric estimations in Table 1 confirm a powerful spatial bias in the academic stream. The public academic high school (SMAN) panel regression models reveal that the Urban1 coefficient is both heavily positive and strictly significant across all cognitive specifications, driven primarily by the Literature Literacy (+6.727; p = 0.000) and Algebra (+4.483; p = 0.000) models.
Meanwhile, the regional variable dummy_timur consistently acts as the most severe penalizing factor for test scores, showing its most extreme drag in the Literature Literacy model at -10.726 with perfect statistical significance (p = 0.000).
Table 1 confirms that an academically oriented upper secondary ecosystem is highly vulnerable to cognitive stratification; local geographic privileges (urban location) correlate linearly with a substantial surge in analytical capabilities, whereas macro-regional isolation in Eastern Indonesia acts as an anchor that restricts students’ reasoning capacities to the lowest baseline.
A starkly contrasting divergence becomes visible when evaluating these parameters against the institutional characteristics of vocational schools, as detailed in the following table.
Table 2: Fixed-Effects Panel Regression Estimations on Regional Sectoral Impacts (SMKN)
| Independent Variables | (1) Lit: Information | (2) Lit: Literature | (3) Num: Algebra | (4) Num: Data |
|---|---|---|---|---|
| merdeka_dummy | 1.186 | 0.933 | 1.802*** | 0.859 |
| (0.195) | (0.326) | (0.005) | (0.163) | |
| RSD | -0.003 | -0.002 | 0.016 | 0.014 |
| (0.889) | (0.951) | (0.250) | (0.376) | |
| RPI | -0.017 | -0.002 | -0.009 | -0.009 |
| (0.351) | (0.940) | (0.450) | (0.500) | |
| SES_school | 0.240*** | 0.194*** | 0.153*** | 0.178*** |
| (0.000) | (0.000) | (0.000) | (0.000) | |
| Urban1 | 1.150 | 1.337 | 1.020 | 1.412 |
| (0.346) | (0.314) | (0.230) | (0.107) | |
| dummy_timur | -7.871*** | -10.266*** | -3.036*** | -5.397*** |
| (0.000) | (0.000) | (0.003) | (0.000) | |
| 3T1 | -4.240* | -10.017*** | 0.182 | -10.053*** |
| (0.085) | (0.000) | (0.911) | (0.000) | |
| Constant | 13.968** | 12.333* | 16.545*** | 16.205*** |
| (0.028) | (0.082) | (0.000) | (0.001) | |
| Observations (N) | 215 | 215 | 215 | 215 |
| R-squared (R2) | 0.649 | 0.641 | 0.636 | 0.621 |
Note: p-values are reported in parentheses below the coefficients. Statistical significance: * p < 0.10, ** p < 0.05, *** p < 0.01.
Table 2 presents latent parameter estimates moving in a distinctly different direction for the public vocational school (SMKN) models. In contrast to the academic track, the Urban1 variable in Table 2 is completely neutralized, losing its statistical significance across all cognitive areas—as evidenced by the Literature Literacy coefficient shrinking to +1.337 and losing significance (p = 0.314). However, Table 2 uncovers a highly destructive new impact on the 3T1 (Remote Region) variable specific to vocational tracks. Scores drop drastically and with high significance by -10.017 (p = 0.000) in Literature Literacy and -10.053 (p = 0.000) in the data logic model.
In summary, Table 2 reveals that curriculum standardization and standardized workshop infrastructure within vocational streams have successfully mitigated local urban-rural privileges. However, vocational schools in remote (3T) regions conversely suffer from an extreme “double isolation” and functional breakdown, driven by the absence of high-quality local industrial ecosystems and corporate partners required for effective apprenticeships.
The core recommendation for policymakers is to move away from rigid, centralized curricular uniformities. This econometric analysis demonstrates that while the academic track (SMA) acts as an inequality incubator preserving urban privilege, the vocational track (SMK) is inherently more adaptive at cutting through local urban-rural biases. Nonetheless, the most glaring policy failure captured across both models is the systemic neglect of macro-geographic isolation in Eastern Indonesia, which suffers from a persistent achievement deficit exceeding 10 points. Until macro-interventions are designed to target regional segregation and implement radical redistribution of high-quality teaching staff to outer regions, administrative standardization will merely perpetuate cognitive stratification.