
The assumption that institutional and bureaucratic reforms at the school level will automatically translate into enhanced student learning capacities has once again reached an impasse. Utilizing longitudinal panel data from a subsample of public vocational high schools (SMK Negeri), an in-depth econometric analysis was conducted to examine how governance interventions impact actual cognitive outcomes, proxied by Numeracy and Literacy Scores. The findings expose a stark reality: the academic performance of vocational students remains heavily constrained by regional disparities and socioeconomic factors, rather than mere curriculum adjustments.
This study employs a log-linear Random Effects (RE) panel data regression model, robust to cluster-robust standard errors at the school level, ensuring that statistical inferences are free from autocorrelation and heteroskedasticity biases. This modeling framework is specifically designed to precisely quantify the determinants of structural factors alongside policy interventions. To test the efficacy of centralized policies, the model integrates two primary cognitive outcomes as separate dependent variables, conditioned on a suite of core independent variables and sociological controls.
Standard Econometric Model Specification: The equation above represents a linear panel data model estimation (Pooled or Random Effects) used to measure the elasticity or marginal impact of governance variables on cognitive achievement. The subscript i denotes the cross-sectional dimension (166 public vocational high school entities), while the subscript t represents the time-series dimension (observation years 2021–2025). The component ui captures unobserved school-specific effects, whereas εit represents the idiosyncratic stochastic error term. An interaction variable (β3) is introduced to detect potential moderating effects, evaluating whether the implementation efficacy of the digital Merdeka Curriculum depends on the baseline level of Data-Driven Reflection within each school.
The controlled panel regression estimates from the model above have been compiled into the following analytical table to compare impact coefficients across student cognitive models.
| Variables | Model_NUM | Model_LIT |
|---|---|---|
| Data-Driven Reflection (RSD) | 0.032 (0.231) | 0.046 (0.291) |
| Merdeka Curriculum (Dummy) | 2.499 *** (0.386) | 6.302 *** (0.162) |
| Interaction (Merdeka × RSD) | -0.005 (0.889) | -0.037 (0.538) |
| Teacher Learning Reflection (RPI) | 0.021 (0.139) | 0.048 ** (0.044) |
| Socioeconomic Status (SES) | 0.203 *** (0.000) | 0.239 *** (0.000) |
| Ratio of PIP Beneficiary Students | 0.014 (0.338) | 0.013 (0.601) |
| Urban Area (Urban Dummy) | 3.031 *** (0.001) | 4.992 *** (0.001) |
| Constant | 35.190 (0.000) | 37.720 (0.000) |
Source: Panel Data Processing Output (2026). Note: Figures outside parentheses represent Regression Coefficients (β); figures in parentheses represent p-values. Asterisks (***) and (**) denote statistical significance at the 1% and 5% alpha levels, respectively.
The synthesis of the regression models demonstrates unequivocally that when success indicators are shifted to the student level, the anticipated efficacy of the Merdeka Curriculum and the Education Report Card Platform or Data-Driven Reflection (RSD) vanishes. In both the Numeracy (NUM) and Literacy (LIT) specifications, the coefficients for RSD and the interaction effect of the Merdeka Curriculum are statistically insignificant, with p-values far exceeding acceptable thresholds. This confirms a decoupling phenomenon, wherein centralized administrative reforms fail to translate into immediate gains in vocational students’ core cognitive performance. Interestingly, the Teacher Learning Reflection (RPI) variable registers a notable resurgence in verbal skills, yielding a coefficient of 0.048 that is statistically significant in the Literacy model (p = 0.044). This indicates that real-world classroom supervision and pedagogical discussions led by school principals remain effective in fostering verbal reasoning cultures among students, even if ineffective in the exact numeracy domain.
To facilitate a visual mapping of this impact divergence and structural inequality, the estimations of key variables within the public vocational school ecosystem are illustrated in the coordinate graph below.
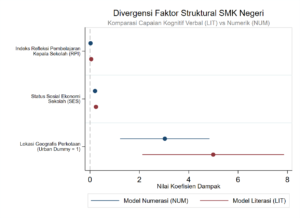
Figure 1 illustrates a dramatic contrast through the horizontal confidence intervals of each structural actor. The point plots for the Teacher Learning Reflection Index (RPI) and Socioeconomic Status (SES) rest precisely near the zero baseline anchor. Although SES contributes a consistently significant positive impact across both tracks (p = 0.000), its absolute leverage is relatively marginal. The true determinant of vocational student outcomes is overwhelmingly dominated by the Geographic Urban Location variable (Urban Dummy = 1), which stands out significantly on the right side of the graph. Public vocational schools located in urban areas record an absolute advantage of 3.031 points in numeracy scores and skyrocket by 4.992 points in literacy scores compared to their rural counterparts.
This spatial profile confirms the bitter reality that geographic factors are far more powerful in dictating core student competencies than administrative curriculum revisions. Urban public vocational high schools are naturally advantaged by their physical proximity to business and industrial ecosystems, which facilitates seamless technological alignment and competency updates. Conversely, rural schools experience structural isolation from industrial networks, leaving their students’ cognitive achievements lagging far behind. The primary challenge facing vocational education today lies not within curriculum documents, but in the glaring inequalities of industrial capital embedded in the very ground where these schools stand.