
Accelerating the quality of upper secondary education in Indonesia is currently confronted with global demands that shift away from merely testing rote memorization. Today, the educational paradigm has pivoted toward assessing critical higher-order thinking skills (HOTS). Utilizing a longitudinal panel dataset from 2021–2025 spanning the public high school (SMAN) ecosystem in Indonesia, an integrated estimation model was constructed to dissect the primary determinants of learning outcomes. Specifically, this analysis evaluates cognitive competency achievements across verbal domains, namely Literary Literacy (\(\mathrm{LIT\_sas}_{it}\)), and quantitative domains, namely Data Numeracy (\(\mathrm{NUM\_dat}_{it}\)).
A panel data econometrics approach is deployed using Random Effects estimation with standard errors clustered at the school level. This study intentionally incorporates multiplicative interaction effects between a school’s Socio-Economic Status (\(\mathrm{SES}_i\)), curriculum policies, and geographic factors. This strategy is adopted to mitigate model specification bias while simultaneously unraveling the underlying causal mechanisms driving gender paradoxes and sub-national class inequalities.

Formally, the structural econometric framework underpinning the entire analysis in this study can be formulated through the following multiple linear regression model:
In this modeling framework, \(Y_{it}\) represents the HOTS achievement score for school \(i\) at time \(t\); \(\mathrm{Merdeka}_{it}\) is a binary indicator for the implementation of the Kurikulum Merdeka; \(\mathrm{SES}_{i}\) denotes the institutional socio-economic status index; while \((\mathrm{Merdeka}_{it} \times \mathrm{SES}_{i})\) and \((\mathrm{Urban}_{i} \times \mathrm{SES}_{i})\) serve as our primary interaction predictors. The matrix \(\mathbf{X}_{it}\) captures internal control variables and school governance factors with the coefficient vector \(\mathbf{\Gamma}\), and \(\varepsilon_{it}\) represents the composite idiosyncratic error term. Upon estimating this interaction model, the interpretation of the main effect coefficient for the Kurikulum Merdeka (\(\beta_1\)) shifts fundamentally. Rather than reflecting a national average impact, it captures the specific impact of the new curriculum under conditions of baseline economic disadvantage—specifically when the school’s socio-economic status equals zero (\(\mathrm{SES} = 0\)).
To facilitate interpretation without compromising academic rigor, all empirical estimation components are presented within an integrated framework. This model consolidates internal school governance configurations, gender dynamics, initial policy interventions, and macro-regional/spatial geographic factors to comprehensively trace the systematic allocation bias of educational quality nationwide.
| Independent & Control Variables | Model (1) Lit: Literacy (\(\mathrm{LIT\_sas}\)) | Model (2) Num: Numeracy (\(\mathrm{NUM\_dat}\)) |
|---|---|---|
| School Socio-Economic Status (\(\mathrm{SES}_i\)) | -0.073 | -0.040 |
| (0.081) | (0.052) | |
| Kurikulum Merdeka (\(\mathrm{Merdeka}_{it}\)) | -12.804*** | -9.036*** |
| (3.451) | (2.201) | |
| Interaction: \(\mathrm{Merdeka}_{it} \times \mathrm{SES}_i\) | 0.301*** | 0.206*** |
| (0.083) | (0.053) | |
| Proportion of Female Students (\(\mathrm{Female}_{it}\)) | -2.457 | -6.135*** |
| (2.186) | (1.518) | |
| Classroom Density Ratio | 0.101 | 0.487 |
| (0.693) | (0.501) | |
| Proportion of Certified Teachers | 0.135*** | 0.082*** |
| (0.022) | (0.017) | |
| Observations (\(N\)) | 618 | 618 |
Table 1 demonstrates that the net main effect coefficient of the Kurikulum Merdeka yields extremely stark negative values, specifically a deficit of \(12.804\) points in \(\mathrm{LIT\_sas}\) (\(se = 3.451\)) and a drop of \(9.036\) points in the \(\mathrm{NUM\_dat}\) domain (\(se = 2.201\)), both reaching absolute statistical significance at \(p < 0.01\). These figures confirm that when an underresourced school at the lowest economic tier (\(\mathrm{SES} = 0\)) is compelled to transition to the Kurikulum Merdeka, student reasoning performance plummets. Conversely, the baseline main effect of socio-economic status under the old curriculum is statistically insignificant, yielding neutral coefficients of \(-0.073\) for literacy and \(-0.040\) for numeracy. However, the policy interaction effect turns highly positive (\(p < 0.01\)) with coefficients of \(+0.301\) for \(\mathrm{LIT\_sas}\) and \(+0.206\) for Data Numeracy. Meanwhile, a gender paradox is captured by the *Female* variable coefficient, which shows a significant negative effect of \(-6.135\) points (\(se = 1.518\)) on numerical reasoning.
These findings underscore that the learning autonomy introduced by the Kurikulum Merdeka inadvertently transforms into a double cognitive burden for vulnerable institutions. Socio-economically disadvantaged schools suffer when HOTS assessments are imposed in the absence of adequate supporting capital. Furthermore, the emergence of a massive negative gender bias in the numeracy domain suggests a phenomenon of collective math anxiety when classrooms are highly homogeneous and dominated by female students. Nonetheless, the model identifies institutional protective anchors driven by human capital: an increased proportion of certified teachers consistently boosts verbal scores by \(0.135\) points (\(se = 0.022\)) and numeracy scores by \(0.082\) points (\(se = 0.017\)). This cognitive leverage is reinforced with absolute significance (\(p < 0.01\)) by a school environment free from bullying (\(\mathrm{BUL}\)), which contributes substantial premiums reaching \(0.478\) points for verbal capabilities and \(0.307\) points for student quantitative reasoning.
| Spatial Independent Variables | Model (1) Lit: Literacy (\(\mathrm{LIT\_sas}\)) | Model (2) Num: Numeracy (\(\mathrm{NUM\_dat}\)) |
|---|---|---|
| Urban Area (\(\mathrm{Urban}_i\)) | 0.451 | -3.056** |
| (1.723) | (1.320) | |
| Interaction: \(\mathrm{Urban}_i \times \mathrm{SES}_i\) | 0.054* | 0.092*** |
| (0.029) | (0.024) | |
| Municipal Administrative Status (\(\mathrm{Kota}_i\)) | 1.897 | 1.957* |
| (1.289) | (1.092) | |
| Central Indonesia Region | -1.570* | -1.632*** |
| (0.825) | (0.555) | |
| Eastern Indonesia Region | -7.903*** | -5.491*** |
| (1.277) | (0.902) | |
| \(R^2\) Overall | 0.638 | 0.633 |
| Intraclass Correlation (\(\rho\)) | 0.649 | 0.545 |
Asymmetries in HOTS achievements across Indonesia are also heavily dictated by the spatial geographic variables shown in Table 2. Structural issues are evident in Eastern Indonesia, which exhibits the deepest cognitive declines, experiencing highly significant absolute deficits of \(7.903\) points (\(se = 1.277\)) in \(\mathrm{LIT\_sas}\) and \(5.491\) points (\(se = 0.902\)) in \(\mathrm{NUM\_dat}\) at the \(1\%\) level. Similar cognitive pressures persist in Central Indonesia, with consistent reductions of \(-1.570\) points in verbal skills and \(-1.632\) points in statistical reasoning. Conversely, urban ecosystems present distinct dynamics; the urban area variable (\(\mathrm{Urban}_i\)) demonstrates a statistically insignificant positive effect (\(0.451\)) in the verbal domain but is associated with a significant decrease of \(-3.056\) points in the numeracy domain within baseline marginal areas. Intriguingly, when interacted with economic status (\(\mathrm{Urban}_i \times \mathrm{SES}_i\)), the regional interaction variable is significantly positive at \(0.092\) points (\(se = 0.024\)) for data logic and \(0.054\) points (\(se = 0.029\)) for \(\mathrm{LIT\_sas}\).
These results indicate that urban settings function as incubators that compound cognitive advantages primarily for schools that possess baseline financial security. The positive spatial interaction demonstrates that urban geographic benefits are inequitably distributed; instead, they entrench privileges that allow high-SES schools to leverage digital infrastructure and urban cultural capital. This disparity is further exacerbated by linguistic biases in Eastern Indonesia, where standard Indonesian is frequently a second language, compounding the chronic misallocation of literacy resources. Amidst the complexities of these spatial asymmetries, the interaction model specifications exhibit a high degree of predictive precision, accounting for up to \(63.8\%\) of data variation (\(R^2\text{ overall} = 0.638\)) in the verbal domain and \(63.3\%\) (\(R^2\text{ overall} = 0.633\)) in numerical reasoning. To aid in interpreting the regression trends, the visualization below graphically plots how the impact direction of the Kurikulum Merdeka operates dynamically across the spectrum of institutional economic capacity.
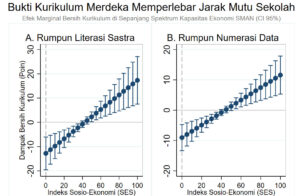 Inequality at the High School Level</caption]
Figure 2 provides visual evidence of the real-world operational mechanisms of the Kurikulum Merdeka. On the left side of the chart, representing the cluster of low-SES schools, the net impact trend line sits well below the zero-baseline anchor, confirming that implementing the new curriculum in disadvantaged schools consistently yields negative outcomes. Conversely, as the graph moves rightward past more affluent economic thresholds, the trend line definitively shifts into positive territory above the zero axis. This visual synthesis strongly validates that the Kurikulum Merdeka widens the school quality gap in a regressive manner.
The policy demands a prerequisite level of economic stability to achieve positive results, causing wealthier schools to rapidly harvest cognitive gains while impoverished schools fall further behind. In light of these evident disparities, this analysis recommends two radical policy transformations to the government. First, the relevant ministry must dismantle the current one-size-fits-all approach and immediately design an asymmetric curriculum support framework that provides tighter instructional structures and affirmative operational aid to socio-economically disadvantaged schools. Second, educational reforms must be targeted toward achieving spatial equity in Eastern Indonesia by redistributing high-quality teaching personnel and redesigning gender-responsive pedagogies to eliminate collective math anxiety in classrooms. Doing so will ensure that the cognitive right to higher-order thinking skills is cultivated for all students, irrespective of social class or geographic boundaries.